


Tariffs hurt domestic consumers
A primer on comparative advantage and trade (part 2)

I promised last week that I would explain why tariffs are regarded by economists as generally bad. This is going to require a longer post than usual, as I am going to assume little or no knowledge of basic microeconomic theory. I will do it in three sections, so if you do know the basics, you can skip to part 3 where I will go over the basic application of tariffs. Or you can just tune in next week for a more normal newsletter.
(Note: this is a long post and depending on your email provider, you may not see the whole thing. To see the whole thing, click to view it online or in the app.)
Part 1 - Supply, demand, equilibrium, and consumer and producer surplus.
Since last week I developed a model of trade using “manufactured goods” and “agricultural goods”, I thought I would stick with an agricultural good, corn. In reality, the US is a net exporter of corn, but for this exercise we will pretend otherwise, since last time I showed the large economy importing agricultural goods from the small country. The US does import many agricultural goods. I just bought an avocado imported from Peru yesterday at the grocery store as an example.
So, we typically present demand curves with the price (P) of a good on the Y-axis and the quantity (Q) of the good on the X-axis. The demand curve (which is a straight line in this simplified model) slopes downward, representing the amount demanded in aggregate increasing as the price of goods decreases. As you can see here, the aggregate demand for corn increases from 10B bushels to 12B bushels as the price per bushel decreases from $5.67 to $5.00, and increases again as the prices falls to $4.33.
Let’s consider the intuition: if you walk into the grocery store in the late summer and you see ears of corn are $0.25, are you more likely to buy them than when they were priced at $0.50? Sure, assuming you like summer corn, which I definitely do.
But corn is a multi-use agricultural product. At high prices, corn is likely only going to be used for its highest value use - probably being eaten as a summer delight. But as corn gets cheaper, it can be used for other things - like feeding livestock. And at cheaper prices, it can be turned into things like shipping peanuts. When something is cheap, we can often find a use for it that we would never do when it is expensive.
Think about water. If water was $1/gallon, would you water your lawn? Probably not. But if water is less than $0.01/gallon, you don’t think twice.
The result is demand curves slope downward.

Supply curves slope upward because the more a good can be sold for, the more attractive it is to producers to make and sell it. Corn is a useful example in this case. Farmers can often grow different crops in the same fields. For example, they might be able to grow corn, wheat, or soybeans on the same land, so every growing season they have to make a choice about which crop they will plant. They have to guess which crop will offer them the most profit. Thus, if they think corn’s price will be high relative to wheat or soybeans, they will plant more acres of corn and fewer acres of wheat and soybeans.

It’s also true that some places can grow corn profitably at lower prices than other places. For example, Iowa is ideal for growing corn with its flat geography and thick and rich topsoil. New Hampshire has rolling hills and mountains, and its soil is rocky. The price of corn can be low and a farmer in Iowa can easily still make a profit on selling it because the cost of raising corn is low in Iowa. You will see corn grown in New Hampshire, but it is nothing like the scale of Iowa, and it is mostly sold to adorable farm stands and the farms make more money selling admission to their corn mazes than they do from actually selling corn. But with a high enough price for corn, farmers in New Hampshire would also grow corn, adding more to the aggregate supply.
Thus, as the price increases, more producers will grow corn, which is why the supply curve slopes up.

We combine the demand and supply curves to find where supply equals demand. This is the equilibrium price and quantity. Suppliers would be happy to provide more than 12B bushels of corn, but they would want more than $5. Consumers would be glad to consume more than 12B bushels of corn, but they would want to pay less than $5. The two parties reach an agreement at $5. While the curves are artificial, the US really does grow about 12B bushels of corn each year, and the price per bushel as of last week was about $5.00.

The demand curve shows that there were consumers who would have been willing to pay more than $5 per bushel - for example, we saw that at $5.67, consumers would have bought 10B bushels of corn. The consumers who were willing to pay $5.67 only have to pay $5 when the suppliers come to market, which makes them happy. This happiness translates into consumer surplus, or the additional value consumers experience when they are able to buy at the market price.
If you have ever walked into a store and found an item, and thought, “I would pay $25 for this [thing]”, and then saw the price tag was $10, and you experienced a bit of happiness, that is you experiencing consumer surplus ($15 of consumer surplus to be exact - $25 willingness to spend, less $10 market price).

The total cost of corn in this market is the price per bushel multiplied by the quantity sold, or $5 x 12B = $60B.
The total value to the consumers is the price they pay plus their surplus, or $60B + 24B = $84B. Since they only have to pay $60B for something they value at $84B, they feel pretty good.

Producers feel pretty good in this scenario, too. There were some farmers who were willing to sell up to 10B bushels of corn for as little as $4.33 per bushel, but they all get $5 per bushel instead. Their producer surplus is $5-4.33 = $0.67 per bushel. Some farmers, probably the ones from Iowa, would have been willing to sell for even less than $4.33, while some farmers needed more. The last farmer willing to sell would have had a minimum price of $5. All the farmers before him wind up getting some surplus. That surplus is represented by the gold colored triangle - the area above the supply curve but below the price. The total producer surplus is also $24B. This means the farmers are pretty happy, too.
(Because of the curves I developed, the producer surplus matches the consumer surplus. This does not have to be the fact in reality.)

The consumers pay the producers a total of $60B for their corn. $24B represents producer surplus, and the other $36B represents the resources used to produce the corn. The resources include the value of the land, the cost of seed, water, etc., as well as the minimum necessary return (profit) to the farmer. Producer surplus is an excess return (profit) to the farmers - excess over and above the minimum necessary for him to stay in the farming business.
This model of equilibrium, with the surpluses and resources used, applies to any good in an economy, not just corn.
So far, we have been dealing with a closed economy - no imports have been considered. Now we add the effect of imports and a world price.
Part 2 - The effect of international trade and a world price.
Last time I showed how, even though “Big Country” had an absolute advantage in producing both agricultural and manufactured goods, the citizens of Big Country would be better off if they traded with “Small Country”. Let’s ignore the benefits to Small Country and just focus on the benefits to Big Country. If we let the US represent Big Country, then we are taking an “America First” perspective. We’ll get to why tariffs do not fulfill the America First promise in the next section. But let’s see trade helps Big Country.

The US isn’t the only country that grows corn. There is a global supply of corn. Corn is basically a weed. It grows pretty much anywhere. The only more weedy crop than corn is wheat. (I could be wrong obout the hierarchy of weediness, but roll with me, it’s not really the point…) The point is that there are lots of other countries growing corn, and it’s easy to ship it around the world. Before Russia started murdering the Ukrainians, Ukraine was one of the largest exporters of corn and other agricultural products in the world. The supply of Ukrainian agricultural products has been dramatically reduced, causing global prices to rise. But I digress…
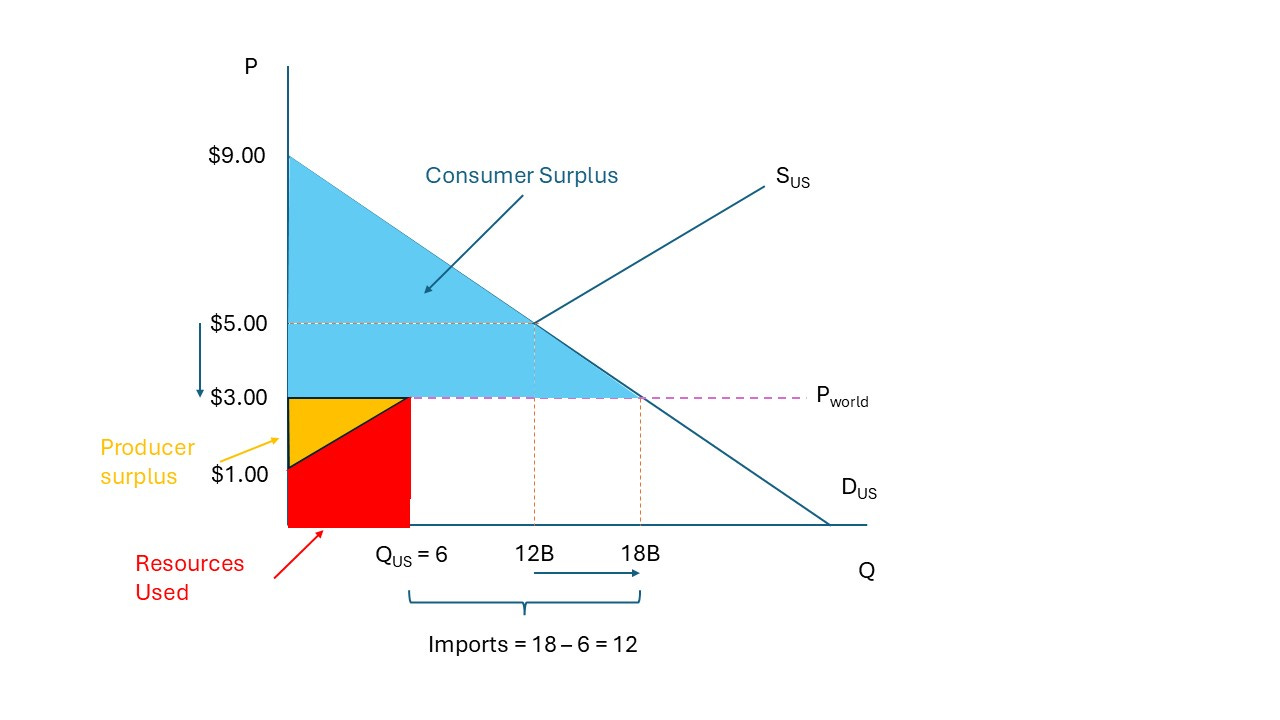
Let’s say that the global price for corn was $3 per bushel, less than the $5 equilibrium price of corn if the US market stood alone. If there was free access to the US market, foreign corn would flow into the US as consumers bought foreign corn (from Small Country). At $3/bushel, consumers would want 18B bushels. This would make US consumers happier, giving them more consumer surplus.

The original consumer surplus is dark blue, the additional consumer surplus is light blue. Consumers’ surplus would rise from $24B to $54B - a huge amount of happiness.
If you figure there are 335M people in the US, $54B would translate into $161 in CS per person, an increase from $71 per person. That’s really good, right?

Not only that, but they are paying less for more! I like paying less for more. Total cost for 18B bushels of corn would be $54B, $6B less than what they were paying for 12B bushels before. That’s a 50% increase in the amount of corn for 10% less than what they were originally paying.

While opening up the US corn market to foreign producers makes consumers better off, it has a negative effect on the approximately 188,000 corn farmers in the US.
The price corn farmers face in the market is no longer $5 but $3. All but the most efficient Iowa farmers would likely have to stop farming corn. US farmers would reduce their corn output from 12B bushels to 6B bushels. Their producer surplus would drop from $24B to $6B. The New York Times would be running exposes about how farmers who had been farming their land for generations were going bankrupt. There would be images of tearful middle-aged men who had not cried since they were 4 years old as they saw their farms sold at auction. I make light here, but there is a real human cost to economic change.
Some of those farmers would simply shift to growing wheat or soybeans, but some would not be able to survive.

The resources - the land, the farms, the farmers themselves - used to produce corn would shrink. The good news is that with time, those resources would be allocated to producing higher-value goods. In the story I told last week, those resources would be allocated to manufactured goods as “Big Country” shifted from agricultural production to manufacturing. This is actually what happened in the early part of the 20th century in the US.
In the long run, this reallocation of resources is a good news story. Once upon a time, there was a lot of corn grown in New Hampshire. Today, there is very little. It doesn't make a lot of economic sense to grow corn at a large scale in New Hampshire. We’re good at maple syrup and ski slopes and leaf peeping. Not so much at corn. It’s better to reallocate corn growing to Iowa, and tourism to New Hampshire.
The point is, trade makes consumers better off, and it frees up productive resources to go to higher value production. It just takes time and ingenuity. The allocation of productive resources to their most productive uses is what makes us rich in the long run.
Part 3 - Tariffs.
Do you think corn farmers are going to “go gentle into that good night”? No! They are going to “rage, rage against the dying of the light”. Specifically, they are going to channel that rage by making donations to their congressmen and senators, and perhaps presidential candidates, whom they will try to convince to do something. You will hear:
"Unfair competition"
"Trade distortion"
"Anti-competitive behavior"
"Market manipulation"
"Predatory dumping"
"Price undercutting"
"Predatory pricing"
"Exploitative trade practices"
Enter the tariff.

The tariff is a fee levied by the government on a good being imported into the country. Assume for the moment that the President assesses a $1 per bushel tariff on corn being brought into the US. if the world price, Pworld = $3, then the new price would be Pworld + tariff or $3 + $1 = $4.
Consumers would now have to pay $4 per bushel, and they would respond by buying fewer bushels. In this case, the demand would drop from 18B to 15B bushels.
Consumer surplus would drop from $54B to $37.5B, a decline from $161 per person to to $112 per person.
US-based farmers would increase their production from 6B to 9B bushels, and would increase their producer surplus from $6B to $13.5, or from about $32,000 in producer surplus per farm to $71,800 per farm.
So consumers lose $16.5B in value, while farmers get $7.5B, where does the rest go?
Part of the value goes to the government in the form of the tariff payments for a total of $6B. Hopefully that money would go to good use, maybe pay off some debt.
$16.5 - $7.5 = $9B
$9B - $6B to tariffs = $3B
So, the producers got some, the government got some, but what about that last $3B? That amount just disappears. Economists call it “deadweight loss” (DWL). No one gets it. On the graphic above, the dark purple triangle on the right is consumer surplus that disappears because of the decrease in the number of bushels sold. The dark purple triangle on the left represents the return resources used that eats up some of the tariff. Deadweight loss is value destroyed.
Bonus: Part 4 - why tariffs are bad - concentrated benefits, diffuse costs
Let’s summarize now why tariffs are bad.
Deadweight loss. It may not be a large loss, but it is value destroyed.
The tariff brings resources back to lower value production. In the last graphic, you can see the increase in resources used to produce the additional corn. Those resources should have been used for something else, whether producing a different agricultural good, or something completely different. It’s not that these resources create no value, it’s that they could have created more value.
Concentrated benefits, diffuse costs. Consumers lost about $50 each, while farmers stood to gain about $40,000. At $50, it’s not worth it for consumers to organize and fight the farmers as they try to manipulate politicians to give them tariff protection. But at $40,000, that’s probably worth writing some letters, and maybe even making some donations to the politician who can “do something”. Tariffs invite corruption into our political processes, particularly because some bigger buyers will try to get themselves exempted from the tariff, make more “donations” to politicians.
OK friends - that’s why tariffs are generally regarded as bad by economists. There are exceptions for narrow purposes, but broad based tariffs are almost always harmful to consumers. And even producers are consumers. And they hurt the integrity of our political system. In other words, they kind of hurt everyone.